

Business Intelligence Services
Enterprise Business Intelligence & Analytics Services for Modern Operations
Convert disconnected data into valuable insights by leveraging the right Business Intelligence Services to gain visibility, enhance speed in reporting, and help you make informed decisions with confidence throughout your organization.
Consult a BI Specialist


Why Enterprises Choose SPEC India For BI Consulting Services
Organizations don't really need dashboards. They need an experienced partner who knows how to navigate their business, advanced data analytics, and business growth. At SPEC India, we provide customized BI solutions that enable leaders to gain a clearer view of user behavior. We help analyze data science for complex data reporting.
220+
Data, BI & AI Solutions Delivered40%
Potential reduction in Manual Reporting effort30%
Potentially faster access to executive insights45%
Enterprise systems integratedYour Trusted Business Intelligence Solutions Provider
At SPEC India, we help you build data-driven reporting ecosystems. Our solutions are scalable and tailored to your business goals, operational processes, and decision-making requirements. As a Business Intelligence solutions provider, we deliver services tailored to your unique data landscape.
Our team works closely with stakeholders to create role-based analytics experiences. We connect business data, establish trusted KPI frameworks, and modernize your reporting environments. We are here to help you strengthen visibility, improve reporting efficiency, and make informed business decisions with confidence.
Challenges & Solutions We Provide for Business Intelligence and Analytics Services
Businesses won't grow without accurate, 100% relevant, timely data insights. We solve data, reporting, and governance issues to provide better visibility and decision-making.

Fragmented Business Data
Business information is scattered across different systems, departments, and locations. We are bringing together disparate data sources into a united reporting environment that creates an enterprise performance view.

Delayed Decision-Making
Business information can be spread across systems, departments, and locations. We consolidate and integrate various data sources into a single reporting system, providing a coherent view of the business.

Manual Reporting Bottlenecks
Teams spend valuable time collecting, validating, and consolidating data from multiple sources. We automate reporting workflows to reduce effort and accelerate access to trusted information.

Inconsistent & Untrusted Metrics
Different teams often rely on separate calculations and reporting standards. We establish centralized KPI definitions and reporting logic to ensure consistency across the organization.

Legacy BI Environments
The problem with outdated BI platforms is they aren't up to the task of meeting the increasingly heavy demands of businesses and their data. We modernize reporting ecosystems with scalable architectures optimized for long-term growth.

Governance & Compliance Risks
The lack of control, combined with unstandardized data management, may increase compliance risks. We establish governance procedures, security measures, and audit visibility to increase trust in the reports.
Ready to turn enterprise data challenges into business clarity?
Whether it's enterprise data silos and disparate reporting, legacy BI systems, or confusion about governance, we can help C-level executives and Business Leaders build a foundation for analytics on which they can scale while enhancing visibility, reporting confidence, and decision-making.
Discuss Your BI ChallengesTailored Business Intelligence Development Services For Enterprise Growth
Business leaders don't need just reports. By gaining actionable insights, they can make faster business decisions, improve governance, and produce real business outcomes. Business intelligence services are custom-curated to your data, goals, and vision for the future.


Business Consulting & Data Analytics Strategy
Ensure that business objectives, reporting needs, and data initiatives are aligned with a solid BI strategy to support informed decision-making and sustainable growth.

Data Integration & ETL Development
Relate data across various systems and sources to give you a unified and continuous basis for reporting, analytics, and business visibility.

Data Warehousing & Lakehouse Architecture
Develop robust data stores that make data easily accessible and enable enterprise-wide reporting and analytics.

Dashboard Development & Data Visualization
Build user-friendly dashboards that enable stakeholders to track performance, draw trends, and make decisions with clear, actionable information

Self-Service BI Implementation
Allow business users to independently access, investigate, and analyze trusted data without compromising that consistency or governance.

AI-Powered Business Intelligence
Make better decisions with intelligent insights, predictive power, and validation automation designed for your business goals and data.

Predictive Analytics & Forecasting
Analyze historical and current data to predict trends, improve planning clarity, and make informed decisions.

BI Support & Maintenance
Maintain reliability, security, and adaptability to business needs in reporting environments through continuous monitoring, support, and optimization.
Modernize BI and Data Visualization Services For Better Business Outcomes
Move from broken reporting systems to a modern BI solution to gain visibility, facilitate timely decision-making, and grow with changing business requirements.
Disconnected Data
The business data warehouse is siloed across systems, resulting in a lack of visibility and making enterprise-wide analysis challenging and time-consuming.
Unified Insights
The integrated data sources offer a uniform view of business performance across departments, functions, and business units.
Manual Reporting
Teams invest considerable time in collecting, checking, and collating data before they can report to their stakeholders.
Automated Reporting
Automated Reporting
Reactive Decisions
Leaders tend to become fixated on the past, which sometimes delays the identification of risks and opportunities
Proactive Decisions
Real-time visibility enables faster responses to changes in the business, operational problems, and new opportunities.
Legacy Platforms
Older reporting environments struggle to support growing data volumes, user groups, and evolving business requirements.
Scalable BI
Modern BI environments enable enterprise growth, effective governance, and future predictive analytics systems.
Business Intelligence Solutions Delivering Measurable Business Impact
 USA
USA


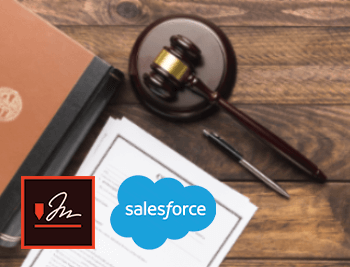
Analytics and Reporting Solution for the Oil Industry
Centralized operational and reporting data, improving visibility, analytics accuracy, and decision-making across oil operations.
 USA
USA

Higher Analytics Adoption
Successfully migrated 500+ reports to a modern platform, improving scalability, performance, and reporting efficiency.
Executive, Operational, And Industry LIVE BI Dashboards
A variety of perspectives are required around performance measures in a business. Organizations benefit from our bespoke BI dashboards, built around leadership priorities, industry needs, and business actions, to monitor, track, and make more visible, confident business decisions based on KPIs.
Executive Dashboards
Develop a unified financial picture and reporting on enterprise financial performance, business growth, operational processes, and strategic KPIs for business leaders.
Industry Dashboards
Get across industry-specific reporting needs using dashboards dedicated to operational metrics, performance indicators, and business goals specific to each industry.
Operational Dashboards
Implement targeted views in reporting to help teams track real-time performance, customer interactions, sales effectiveness, team productivity, and operational intelligence.
From Scattered Data To Decision-Ready Business Intelligence
Effective business intelligence starts long before dashboards are built. We help organizations connect fragmented data, establish a foundation for trusted reporting, standardize KPI definitions, and deliver role-based insights that support faster, more confident decisions.
Scattered Systems Become Connected Data Sources
Connected Data ViewUnify Enterprise Data Across Systems
Bring information from multiple business applications into a centralized reporting environment.
-
ERP
Orders, inventory, finance -
CRM
Customers, pipeline, sales -
Excel
Reports, spreadsheets, tracking -
APIs
Cloud apps, third-party data
Raw Data Becomes Trusted Business Data
Validation ViewEstablish Reliable Reporting Foundations
Validate, standardize, and prepare data to improve reporting accuracy and business confidence.
-
Quality
Accuracy, completeness, consistency -
Validation
Rules, checks, controls -
Standardization
Formats, definitions, structures -
Monitoring
Errors, exceptions, anomalies
Different Metrics Become Shared Business Logic
KPI logic viewCreate Consistent Performance Measurement
Align reporting rules and KPI calculations across departments and business functions.
-
Revenue
Growth, profitability, future trends -
Operations
Efficiency, utilization, output -
Sales
Pipeline, conversions, targets -
Finance
Margins, budgets, forecasts
Organized Data Supports Better Data Analysis
Data model viewStructured Data Information For Enterprise Reporting
Create reporting-ready models that support performance analysis and business intelligence initiatives.
-
Dimensions
Products, customers, locations -
Measures
Revenue, costs, quantities -
Relationships
Links, mappings, hierarchy -
History
Trends, periods, comparisons
Align Dashboards With Business Roles
Dashboard viewShared Data Powers Personalized Views
Provide tailored reporting experiences based on stakeholder responsibilities and priorities.
-
Executive
Strategy, growth, performance -
Finance
Revenue, budgets, forecasting -
Operations
Efficiency, productivity, capacity -
Sales
Pipeline, targets, conversion
Reports Become Faster Business Decisions
Insights viewEnable Confident Strategic Action
Empower leaders with timely insights that support planning, performance management, and growth.
-
Monitor
KPIs, trends, exceptions -
Forecast
Demand, revenue, related resources -
Optimize
Business processes, costs, outcomes -
Act
Planning, execution, strategy
Governed BI For Trusted Enterprise Reporting
Enterprise reporting requires more than data visibility. Effective governance practices facilitate access to consistent metrics, secure access, trusted information, and reporting processes, all of which will enable confident decision-making across the organization

Role-Based Access
Enable users with responsibility, department, business unit, and/or reporting requirements; Control data appropriately.

Row-Level Security
Only users with the appropriate role will have access to the data that is important to them.

KPI Standardization
To ensure teams use the same definitions, calculations, and reporting conventions for KPIs, work with trusted, aligned metrics.

Data Quality Rules
Implement validation, monitoring, and quality control to ensure report accuracy and minimize inconsistencies between diverse data sources.

Audit Visibility
Monitor access to reports, dashboard usage, customer experience refresh, and new revenue streams to reinforce governance and accountability.

Secure BI Architecture
Enable secure pipelines, access controls, publishing controls, and enterprise-class reporting.
Business Intelligence Technology That We Work With
BI & Visualization
- Power BI
- Tableau
- Qlik Sense
- Looker
- HighCharts
Data Engineering & Integration
- Azure Data Factory
- AWS Glue
- SSIS
- Pentaho
- APIs
- ETL/ELT
Cloud Data Platforms
- Snowflake
- Azure Synapse
- AWS Redshift
- BigQuery
- Databricks
- Microsoft Fabric
Databases & Sources
- SQL Server
- PostgreSQL
- MySQL
- Oracle
- Salesforce
- SAP
- ERP
- CRM
Build A Business Intelligence Foundation That Scales Data Analytics
Connect all systems, reporting, and business analytics with customized BI services to increase visibility, improve governance, and enable faster decision-making.
Build Your BI RoadmapOur Approach To A Successful Business Intelligence Implementation
Each organization's reporting requirements, data issues, and business objectives are different. We provide operational efficiency and scalable ways to build BI solutions with measurable outcomes that align with your strategy.

Discovery & Assessment
Evaluate current systems, reporting, stakeholders' needs, and issues.
01
KPI Strategy
Define business metrics, reporting priorities, and performance measurement goals.
02
Architecture Design
Build scalable data models, data integrations, governance, and reporting BI solutions.
03
Adoption & Optimization
Enable user adoption, track performance, and enhance reporting seamlessly.
05
Development & Data Integration
Create data pipelines, Dashboards, reports, and integrated BI Systems.
04
Dashboard Prototyping
Develop dashboard ideas that support user roles, customer behaviors, and business goals.
BI Use Cases Across Key Industries
Every industry faces unique reporting, operational, and performance challenges. We design tailored BI solutions that help organizations improve visibility, standardize reporting, and make faster, data-driven decisions.
Logistics & Freight

Gain visibility into shipments, carrier performance, delivery timelines, freight costs, and data warehouse operations through centralized reporting and analytics.
- Shipment Dashboards
- Carrier Analytics
- SLA Tracking
- Warehouse Performance
- Route Profitability
Retail

Monitor sales performance, inventory movement, customer behavior, demand patterns, and channel effectiveness through unified retail intelligence dashboards.
- Sales Dashboards
- Product Performance
- Demand Forecasting
- Inventory Analytics
- Customer Segmentation
Manufacturing

Track production efficiency, machine utilization, inventory levels, quality metrics, and plant performance through connected operational reporting systems.
- Production Dashboards
- OEE Tracking
- OEE Tracking
- Inventory Visibility
- Maintenance Reporting
Energy & Utility

Monitor asset performance, energy consumption, outage trends, field operations, regulatory reporting, and forecasting requirements across distributed networks.
- Energy Dashboards
- Outage Reporting
- Demand Forecasting
- Demand Forecasting
- Field Operations
Flexible Engagement Models For Enterprise BI Projects
Every BI initiative has different goals, timelines, and resource requirements. Choose an engagement model that aligns with your project scope, delivery expectations, and long-term business objectives.
Fixed Cost Project
Ideal for BI projects with clearly defined requirements, deliverables, timelines, and success criteria. We establish scope up front and deliver against agreed-upon milestones and outcomes.
- Defined scope and deliverables
- Fixed timeline and budget
- Milestone-based project execution
- Best for well-defined BI initiatives
Dedicated Team
Suitable for evolving BI programs that require continuous enhancements, ongoing support, and flexible resource allocation aligned with changing business priorities.
- Flexible scope and priorities
- Monthly resource engagement model
- Direct collaboration with data scientists
- Easy team scaling as needed
What Clients Say About Working With SPEC INDIA
Trusted by clients,
proven results.
(151+ Reviews)

 SPEC INDIA delivered the software on time. Their team showcased professionalism, communicated clearly, and adapted the client’s tools and development cadence. Despite the client’s team being understaffed, the vendor facilitated an effective workflow for both parties.

Doug Stoddart
CEO, Bike Rental Manager
SPEC helped us adapt to the changing needs and create a comprehensive portal that could do AI Psychometric Analysis and track incoming data. I thank SPEC INDIA and hope the support continues in the future too.

Kriti Anand
CoFounder, CAREERKUL
SPEC INDIA helped us to build the architecture and roadmap of our main product. We got great support for the design and launch of our go-to-market mobile app. Looking forward to continuing our partnership. I highly recommend SPEC INDIA.

Karam Sethi
CEO & Co-Founder - Terra Digital
Very well managed & good delivery. They deliver insights, ideas and suggestions so we can deliver a better project. Happy with the delivery.

Fredrik Wittboldt
CEO, Dynamic Documents
SPEC INDIA has been an excellent company to work with, with commendable IT technical expertise and business analytics skills. We have received great implementation ideas to improve system’s performance and appreciate their involvement in our digitization journey.

Vinod Kadia
Manager IT&ERP - Gujarat Gas Limited
SPEC is our preferred tech partner. It was a good digitization journey and cloud migration also flawless. The team is very responsive and project management was good.

Ravi Razdan
Head of IT & HR - Jyothy Fabricare Services LtdFrequently Asked Questions
Address common questions about business intelligence and analytics services that many business leaders have when creating, modernizing, or scaling their enterprise intelligence projects.
Let’s get in touch!
India
“SPEC House”, Parth Complex, Near Swastik Cross Roads, Navarangpura, Ahmedabad 380009, INDIA.
-
 +91-79-26404031, 32, 33, 34
 -
 lead@spec-india.com
USA
“SPEC Partner”, 350 Grove Street, Bridgewater, NJ 08807, United States.
-
+1 908-450-9862
-
lead@spec-usa.net


