


Our First-rate Data Visualization Services
Make the most of your data silos by unlocking different ways of data visualization and analysis to achieve your business goals. our extensive data visualization consulting services enable us to convert raw data into comprehensible formats regardless of data type. Declutter huge volumes of data for better monitoring, prediction, and opportunity realization to enhance the decision-making process.
Interactive BI Applications
Centralize and transform your data storage for better data collection, analysis, and sharing with our business intelligence app development services. Our BI app development specialists offer data visualization consulting for interactive app development solutions and strategies to drive improved business decisions to maximize ROI through advanced analytics features which enable real-time monitoring of your data analytics metrics.

Paginated Reports & Dashboard Development
From C-suite managers, mid-level management, and data experts to varied users, we offer paginated reports and intuitive dashboards with custom elements like graphs, charts, maps, and more to ease specialized data analytics requirements. We at SPEC INDIA specialize in data visualization as a service providing personalized tactical, strategic, leadership, operational, and analytics dashboards along with the ability to integrate them with your existing systems or software.

Data Visualization Implementation
Ease your specific data visualization and analytics need with our personalized data visualization strategy and implementation of data visualization solutions. Our data visualization consultant would research, analyze, and implements efficient data visualization techniques which are best fit for your requirements to unlock masked opportunities and unlock new business growth perspectives.

Custom Dashboard Development
Accord your business the power of data analytics with strategically crafted custom dashboards aligning with the specific analytics requirements. Avail SPEC INDIA’s data visualization service to leverage fully customized data visualization solutions for your specific KPIs and data from various sources. Our dashboards are designed to provide consumable data formats for a range of users from experts to novices.

Dashboard Optimization
The hefty volume of data and information from various sources channeled into dashboards can be chaotic for analysis. With SPEC INDIA’s data visualization consulting services, our data visualization consultant ensure that your dashboards meet your specific expectations by optimizing visualizations for improving access, interactions to reduce the load time, optimizing database for querying, and seamless rending of data insights on various devices.
Data Visualization with Cloud Services
Not only interpreting data in natural language but also real-time analysis of high-volume data, our data visualization consultant leverage AWS, Azure, Google Cloud, and more for channelizing the data silos into the dashboard from various cloud sources. We make facilitate the business to integrate high-volume data from various courses in the cloud into a single custom dashboard to drive the ease of decision-making for businesses.
BI Migration
Simplify the colossal task of migrating your huge volume of data from legacy to a modern BI platform or data visualization solutions like Power BI, Tableau, etc with our BI migration service. Our BI experts also facilitate migration from one BI/ ETL tool to another or upgrading to the new various BI/ ETL tools. With our data visualization service, you can connect with our experts who ensure high performance, minimal downtime, and accurate migration.
Data Platform Development
Make your existing data platform future ready with innovative methods to modernize it. Our data visualization development experts can build you a custom data platform that supports analytics and BI. We employ ETL and OLAP to integrate the data from various sources with the data platforms. Visualize your data with our data platform development service to back your decision-making with actionable insights.

Data Visualization Consulting from the Best in the Business!
SPEC INDIA’s data visualization services can help your business to leverage business intelligence for data-backed business decisions. We help businesses visualize patterns, trends, and business opportunities from your data silos.
-

Power BI
-

Tableau
-

Pentaho
-
SSRS
-

Excel
-

Logi Composer
-

ADF
-
PDI
-

AWS Glue
-

Hevo
-
SSIS
-
SQL Server
-

Azure Synapse
-

Redshift
-

MySQL
-

Snowflake
-

PostgreSQL
SPEC INDIA as a Data Visualization Company
200+
Projects Delivered96%
Enterprise Client Retention5+
Average Resource Experience10
Clients of 8+ years40+
Countries Served4.8/5
Customer RatingsWhy Utilize SPEC INDIA’s Data Visualization Services?
Unlock silos of information to drive transformation for your business with improved decision-making powers. These data visualization services help businesses irrespective of niches to better organize data for better breakdown and understanding of data.
Curtail Spreadsheets Requirement01
Eliminate the requirement of dozens of frustrating spreadsheets for data tracking and reporting for your business. Make data decoding easier with better visual representation using advanced data visualizations of real-time data to help foresee business opportunities.
Easy Complex Data Interpretation02
Unclose the previously invisible patterns to formulate valuable insights, recognize relationships and give greater meaning to the data silos with data visualization strategies. The tables, charts, maps, graphs, and more enables the user to easily digest huge volumes of data.
Efficient Data Filtration03
Uncover the crucial components or details of the data coming from various sources by the users or departments of your organization through dedicated dashboards. Our data visualization consulting enables the users to have a different perspective of the data by channeling it.
Customized Reports04
Reports are a crucial aspect of any organization and maintain the pace of productivity consistently in every department. The customized reports allow the C-suite manager and experts to track the KPIs effectively and realize the factors affecting productivity or business growth.
Foresee Emerging Trends05
Escalate business profits by recognizing the market shifts for the benefit of the business. Data visualization enables to leverage the of emerging trends by taking a closer look at the fluctuating patterns of data in dashboards and hence eliminating the consequences of a failed strategy.
Stamp Out Bottlenecks06
To rectify mistakes, identifying erroneous data is crucial. Our data visualization service enables the business to have a clear picture of data silos. The enhanced interactive data visuals help to eliminate erroneous data from the following data sets.
Hire Data Visualization Developers
Level up your ways to interact with data with SPEC INDIA’s data visualization consulting services. Our data visualization developer would assist you with various data visualization strategies to enhance the trajectory of business growth.
Speak To Our Experts
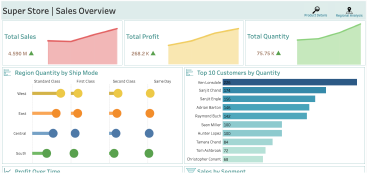
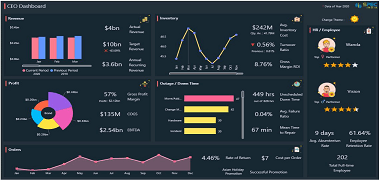
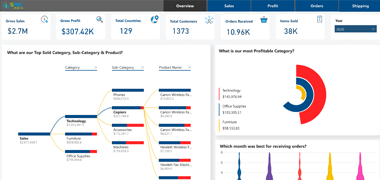
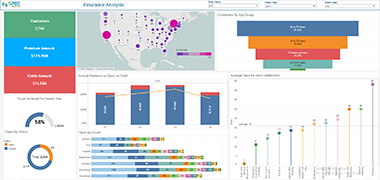
Our Live BI Visualization
Industries We Serve
Discover the diverse range of industries we proudly support with our innovative software solutions to companies of different business verticals. Our expertise spans multiple sectors, ensuring tailored services for every unique need.


")


Frequently Asked Questions
Data visualization transforms raw data into actionable insights, helping you identify trends, optimize operations, improve decision-making, and gain a competitive edge.
We have expertise in data visualization, consulting, and custom dashboard creation across industries, including healthcare, fitness, finance, retail & eCommerce, manufacturing, and supply chain & logistics, tailoring solutions to meet industry-specific challenges.
Some of the best data visualization tools are:
- Microsoft Power BI
- Tableau
- Qlik Sense
- Qlikview
- Looker
- Zoho Analytics
- Google Charts
The list does not end here; there are numerous tools that businesses can leverage according to the data visualization requirements.
The timeline depends on the complexity of the project, but we follow an agile approach to deliver incremental results, ensuring quick wins and continuous improvement.
There is no fixed amount of dashboard development. There are a variety of factors that affects the overall cost of dashboard development for different projects like the scope of the project, complexity, cost of hiring a data visualization consultant, and more. The business can consider these factors to estimate the approximate cost of dashboard development.
SPEC INDIA is a top-tier data visualization service provider with decades of industry experience. We follow a well-crafted, step-by-step process to deliver impactful visualizations:
- Understanding Your Business Needs: We begin by collaborating with you to identify key objectives, challenges, and goals to ensure the visualization aligns with your business strategy.
- Data Collection: We gather relevant data from multiple sources, ensuring accuracy and completeness for a strong foundation.
Data Cleaning: Raw data is processed to remove inconsistencies, duplicates, and errors, ensuring high-quality inputs for analysis. - Data Modeling: We structure and organize the data into meaningful relationships, enabling efficient analysis and visualization.
- Selecting the Right Visualization Tools: Based on your requirements, we choose the most suitable tools and technologies, such as Tableau, Power BI, QlikView, D3.js, or Python libraries like Matplotlib and Seaborn, to create dynamic and interactive visualizations.
- Designing Interactive Dashboards: Our team designs intuitive and visually appealing dashboards that make complex data easy to understand and explore.
- Delivering Actionable Insights: We provide clear, actionable insights that empower your team to make data-driven decisions and achieve business goals.
Businesses can opt for data visualization techniques based on data format/type and visualization goal. Here are some of the best data visualization techniques that companies can utilize:
- Charts
- Tables
- Graphs
- Maps
- Plots
- Infographics
- Diagrams
- Dashboards
- Matrices
We leverage advanced data processing and modeling techniques and tools like Apache Spark, SQL databases, and cloud platforms (AWS, Azure, Google Cloud) to efficiently manage and visualize large datasets.
Absolutely. We use APIs, ETL pipelines, and middleware solutions to ensure seamless integration with your existing systems, whether they’re CRMs, ERPs, or custom databases.
Yes, we design real-time dashboards using tools like Power BI, Tableau, and custom-built solutions to help you monitor live data and make instant decisions.
To protect your data throughout the visualization process, we follow strict data security protocols, including encryption, access controls, and compliance with regulations like GDPR, HIPAA, and CCPA.
Let’s get in touch!
India
“SPEC House”, Parth Complex, Near Swastik Cross Roads, Navarangpura, Ahmedabad 380009, INDIA.
-
 +91-79-26404031, 32, 33, 34
 -
 lead@spec-india.com
USA
“SPEC Partner”, 350 Grove Street, Bridgewater, NJ 08807, United States.
-
+1 908-450-9862
-
lead@spec-usa.net


