

Transform Online shopping with eCommerce Business Intelligence Solutions
This was a client from an online shopping company in Cyprus. Its primary goals were to improve the managing of corporate eCommerce and shopping processes by using a business intelligence application development. Their aim was to give their users a better shopping experience by providing them with beautiful deals and product comparisons and a list of shops within which they can purchase these products.
-
Industry
eCommerce & Shopping -
Country
Cyprus
Technologies
 Power BI
 Zapier

Years In Business

Projects Delivered

Happy Clients

Countries Served
Business Goals & Expectations
- The client’s main objective was to design and develop a eCommerce business intelligence (BI) solution that can resolve there major challenges.
- They wanted a centralized platform where they could offer a variety of deals and discounts, the best offers, coupons, or rewards. They wanted to attract the customers and make them loyal.
- Moreover, they also wanted some options that could allow them to provide a comprehensive product comparison.
Challenges Faced by Client

Visualizing Business Requirements
The client was unable to transform his business requirements into one concise reporting structure in a way that enabled him to clearly view the big picture.

Consolidated View of Locations
This was reaching a point where they were unable to get a single window view of all their places of operation, and hence the tough time in managing their operations.

Effective Shopping Options
They required a business intelligence application, which would allow users to select different effective and realistic shopping choices.

Monitoring eCommerce Activities
They described difficulties in controlling and knowing the detailed state and type of online shopping and eCommerce, which consequently influenced their decision-making.
Our Solution
-
Time & Material Process with Agile Approach
We utilized an adaptive approach in order to create a viable concept for the product and a conceptual map of the state and appearance of the product during its development.
-
Marketing Campaign Insights
We made sure that our client gets a unified view of their marketing campaign in their power bi ecommerce dashboard. We added the power BI reporting feature where they can get an overview of marketing campaign performance through the number of impressions and clicks using the key performance indicators.
-
Automated Data Gathering
Employed the help of Zapier to create workflows for data collection with Zaps.
-
Multiple Dashboards
Our team developed various dashboards with Google Drive and Google API as the data sources such as Performance dashboard, Billing dashboard as well as End Point analysis dashboard.
-
Data Synchronization
We Saved the data files in Google Drive to fetch and sync the files with local system directories in order to get the data into the Power BI app.
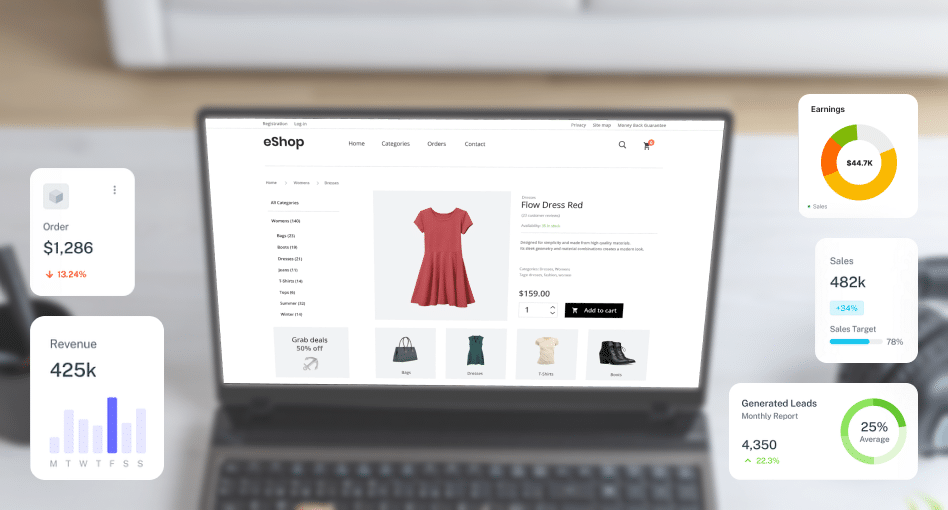
Project Glimpse


Key Features
Commission Tracking

Conversion Dashboard
Redirect Tracking

Cost of Sale

Commission Payments

Master File Management

Billing Dashboard

Endpoint Analysis

Campaign Profitability

Click Discrepancy

Revenue per Click
Results and Achievements
-
01.
Enhanced Decision-Making
Enhanced management of the marketing campaigns due to the increased ability of gathering relevant data.
-
02.
Sales Performance and Targeting
Increased the sales team performance and management of incentives and improved sales targeting and focusing on particular customers when selling certain products.
-
03.
Increased Sales and Reach
We helped our client in increasing the sales for a range of products in specific areas and categories. They were also able to successfully broaden their reach to clients and potential buyers.
-
04.
Real-Time Information and Future Insights
Open real-time access of information along with relative important data for future business scenarios and contributed significantly for increasing the organizational effectiveness with the coverage of market boundaries.
Let’s get in touch!
India
“SPEC House”, Parth Complex, Near Swastik Cross Roads, Navarangpura, Ahmedabad 380009, INDIA.
-
 +91-79-26404031, 32, 33, 34
 -
 lead@spec-india.com
USA
“SPEC Partner”, 350 Grove Street, Bridgewater, NJ 08807, United States.
-
+1 908-450-9862
-
lead@spec-usa.net


