


Marketing Business Analytics Solution for Financial Firm

Client-Business-Goal
They were keen to design and develop a one-stop marketing business intelligence solution that can get meaningful insights by tracking the user traffic to the website, user response on the products placed on the website, campaign management with cost of campaigns per users and the best and worst campaigns on the social media platforms.
Key Challenges
It was difficult to manage all significant KPIs in the same Power BI report. There was an issue on Google Analytics Dimension incompatibility and threshold issues. It was tough to generate access tokens for social platform marketing APIs.
Our Approach
Looking at the challenges faced by the client, SPEC INDIA followed the Time and Material model with the Agile approach to develop roadmap and architecture of the product. We designed and launched the Power BI reports and dashboard, after identifying and researching on various modern methodologies.
Our Solution
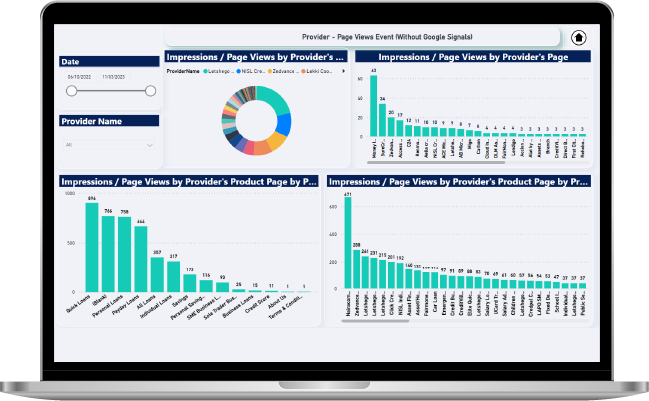
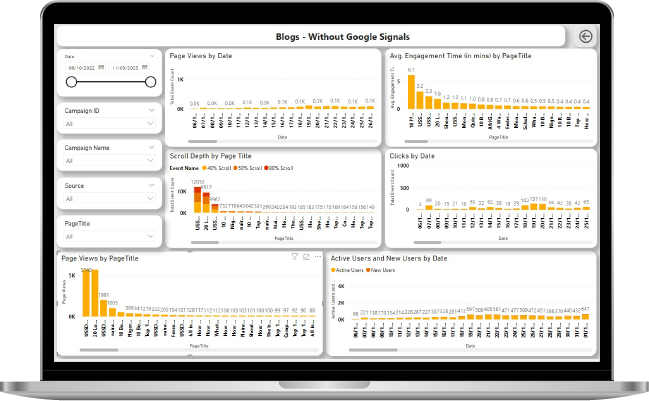
We have designed and developed Power BI and analytics reports that offer intuitive information for different features like user traffic insights to client based on the different campaigns running on social media platforms and measuring user interest in the products on their websites. The project also provides insight into blogs and other user interests depending on the location.
Data of Google Ads comes from Google Sheets and data is obtained in Power BI through Google Sheets Connector. Social Ads data (Meta & LinkedIn) is fetched using respective marketing API. The Data View availability from is the production Azure SQL Server.
We have handled the dimension incompatibility issue by offering another dimension as a substitute and achieving the same results. There is an alternate way to access social media marketing APIs using third-party tools.
Key Inclusions
Provider’s Power BI reports implemented with row-level security
New Facebook account integration with Power BI
New ETL development for marketing analytics (market qualified leads & sales accepted leads)
Google Ads, Meta Ads & LinkedIn Ads - R & D, ETL & Power BI report development
Resolution to data mismatch issue in Google Analytics & Power BI reports
Blogs Demographics – Without Google Signals Active users and new users by City, OS, Browser type, Device category
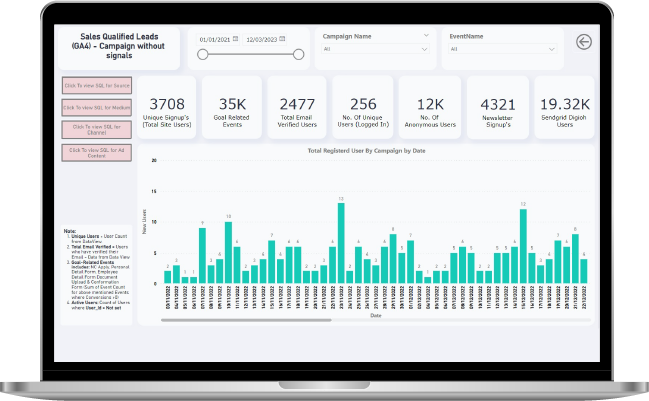
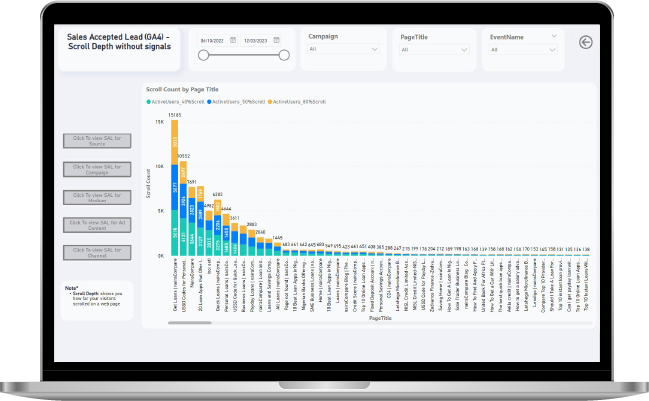
Marketing Qualified Lead Campaign/Ads
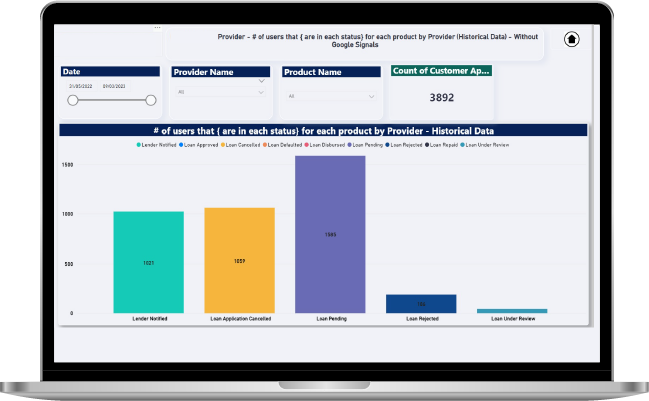
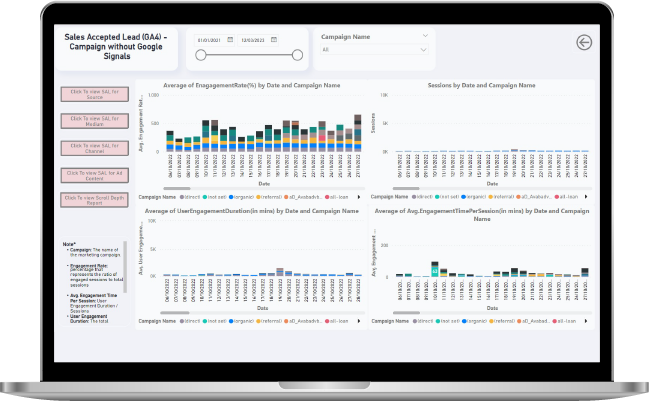
Sales Accepted/Qualified Leads
Screens

Do You Want To Gain Better Insights For Your Business?
We have helped a number of global clientele with our analysis and reporting services to drive better performance based on data
Technologies & Tools


Our Process
Research/Analysis
Our detailed and accurate research, analysis, and refinement leads to a comprehensive study that describes the requirements, functions, and roles in a transparent manner.
Design
We have a team of creative design experts who are apt at producing sleek designs of the system components with modernized layouts.
Coding
Our programmers are well versed with latest programming languages, tools, and techniques to effectively interpret the analysis and design into code.

Testing
Quality is at the helm of our projects. We leave no stone unturned in ensuring superior excellence and assurance in all our solutions and services.
Launch
We have well-defined, robust, and secure launch criteria that offer us a successful implementation clubbed with detailed testing, customer acceptance, and satisfaction.
Business Benefits
Enhanced decision-making in : Improving the worst running campaign for better traffic to the website. Effective spending on the campaigns. Increasing the product spread based on user interests.
Data analysis and interpretation
Decision support and validated information
Trends and patterns in data visually, through charts and tables
Ability to filter / show data using selected criteria
Let’s get in touch!
India
“SPEC House”, Parth Complex, Near Swastik Cross Roads, Navarangpura, Ahmedabad 380009, INDIA.
-
 +91-79-26404031, 32, 33, 34
 -
 lead@spec-india.com
USA
“SPEC Partner”, 350 Grove Street, Bridgewater, NJ 08807, United States.
-
+1 908-450-9862
-
lead@spec-usa.net


